Bottom panel
The bottom panel of the user interface displays a range of valuable information related to the selected object.
Firstly, it presents the data associated with the selected object, which can provide insights into its status, performance, and behavior. This information could include attributes such as temperature, pressure, speed, or any other relevant parameters that are being monitored.
In addition, the bottom panel also features a history graph that charts the behavior of selected sensors over a specified time period. This feature can help to identify patterns or trends in the data, allowing users to make informed decisions based on the insights gathered.
Finally, the bottom panel contains a location message table that displays information about the object's whereabouts. This table can give the user an overview of the object's movements and the sensor's information received.
Overall, the bottom panel is a valuable resource that provides users with a comprehensive view of the selected object's status, performance, and location.
Data
The lower panel of the interface presents comprehensive data pertaining to the selected object, encompassing its current location coordinates and address, its current status, the duration of its movement or offline state, its velocity, the active sensors of tracking device, as well as a plethora of other pertinent information.

Additionally, it is possible in Settings to enable widgets on the bottom panel:
Object control - allows to send SMS/GPRS commands from the bottom panel to the selected object.
Recent events - displays a list of recent events related to the selected object.
Recent tasks - shows a list of recent tasks performed on the selected object.
Mileage - displays the mileage of the selected object for the last five days.
Speedometer - presents the speed of the selected object using an analog speedometer.
Notes - allows users to type notes related to the selected object.
Photo - enables users to attach an image to the selected object.
Daily statistics - provides daily statistics for the selected object.
Graph
The Graph tab displays information in the form of diagrams for the selected object and the chosen time period.

Please note
The dropdown menu allows you to select up to three diagrams to be simultaneously displayed.
Messages
The Messages tab allows you to view the information sent by the tracking device to the GPS server software for the selected period of time.
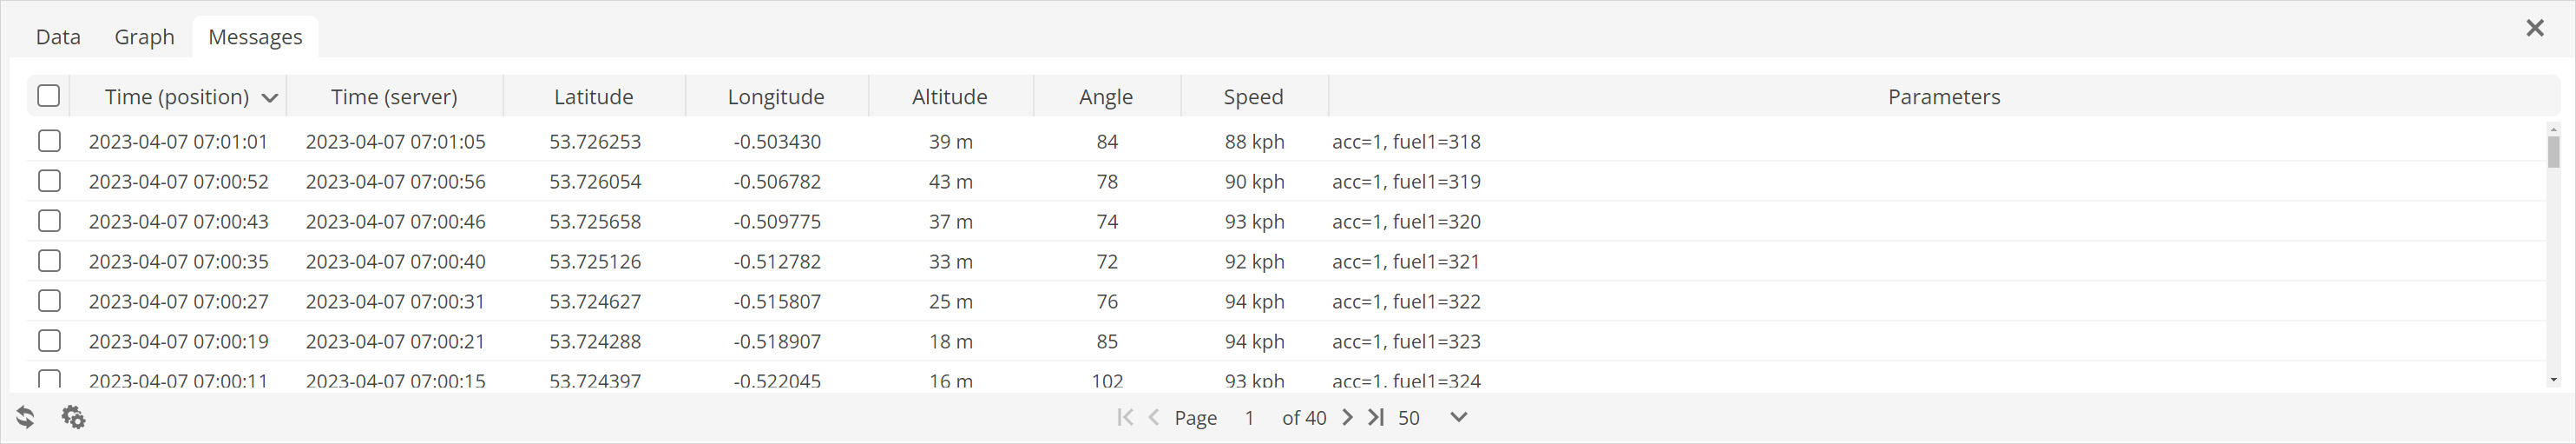
Time (position) - the time when the message was sent from the tracking device.
Time (server) - the time when the message was received by the GPS server software.
Latitude - the latitude of the location of the object on the coordinate system.
Longitude - the longitude of the location of the object on the coordinate system.
Altitude - the altitude of the object relative to sea level.
Angle - the current angle of the object in degrees (0-360° clockwise movement).
Speed - the speed of the object at a certain time.
Parameters - the data generated by the tracking device.
 - refreshes messages list.
 - open action menu:
 - deletes all selected messages records.